When there is a correlation between two variables, it indicates that when the value of one variable changes, the other variable also changes in one direction. There is a difference between correlation and regression. Determining this relation is quite helpful since you can use the value of one variable to predict the value of another variable successfully. For instance, height and weight also have an appositive correlation because as the height of a person increases, the weight normally increases as well. Consequently, if you see an individual who is unusually tall, it can be said that their weight is also higher than average.
In the world of statistics, a correlation coefficient is a measure that helps you analyze the direction as well as the strength of the tendency of variables to differ together.
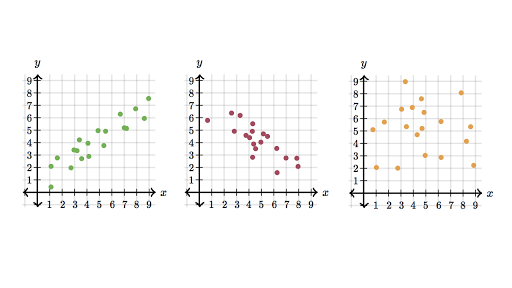
Scatterplots are one of the ways you can use if you want to check for a relationship between two pairs of continuous data. A scatterplot is a graphical representation of the relationship between two variables.
The correlation coefficient is represented by a Greek Letter rho. It is a parameter for sample statistics. A coefficient is a single number that enables you to measure the actual strength of the direction of the relationship between two variables. The value of this relationship can lie anywhere between -1 and +1.
Strengths
When the absolute value is greater, the correlation coefficient is stronger for the relationship. When you get an extreme value such as -1 or +1, there is a linear relationship between the variables. This means that one change in one variable will have an equal and consistent change on the other variable as well. In the case of such a relationship, the data points usually fall in one single line. However, this type of relationship is not normally seen in practice.
If you get a coefficient of zero, it means that there is no relationship between two variables. If there is a change in one variable, it will have no significant effect on the other variable.
When you get a value that lies between -1 and +1, there exists a significant relationship between two variables. However, the points of the relationship do not fall in one single line. When the r approaches one extreme, the strength of the relationship starts to increase and the data points start to come closer.
The sign of the correlation coefficient will show the direction of the relationship.
A positive coefficient means that when one variable increases its value, the other variables value also increases. If you get a positive relationship, an upward slope will be produced on the scatterplot.
On the other hand, a negative coefficient means that when one variable increases its value, the other variables aloe decreases. If you get a negative relationship, a downward slope will be produced on the scatterplot.
Now that you have all the right information, you can successfully interpret a correlation between two variables of data sets.